Maternal Risk for Hypertension and Diabetes and Length of Breastfeeding

This systematic review and meta analysis assessed the association of breastfeeding with diabetes and hypertension amongst parents who breastfed for at least one year compared to less than one year. “Association of Maternal Lactation With Diabetes and Hypertension: A Systematic Review and Meta-analysis.”(1.)

Suzanne Sanders here, IBCLC for another article review.

Before we jump to the results, let’s dig in to the nitty gritty.

The systematic review encompasses 22 studies that look at breastfeeding in relation to hypertension and/or diabetes. They give brief overviews of many of these studies and it includes studies that compared different lengths of breastfeeding, not strictly 1 year.

For the meta analysis they found 4 studies that fit the criteria for breastfeeding and diabetes. Amongst these four studies, there was a total of 206,204 participants. 5 studies fit the criteria for breastfeeding and hypertension and their total participant count was 255,271 women.

The authors concluded from the meta analysis that “Breastfeeding for more than 12 months was associated with a relative risk reduction of 30% for diabetes (pooled odds ratio, 0.70 [95% CI, 0.62-0.78]; P < .001) and a relative risk reduction of 13% for hypertension (pooled odds ratio, 0.87 [95% CI, 0.78-0.97]; P = .01).” (1.)

What I am learning is a more appropriate title today. What exactly does it mean when the authors say a 30% RELATIVE RISK reduction or a 13% RELATIVE RISK reduction. Well I did some digging and it seems far more complex than something I can boil down to one short paragraph. If you want to sink your teeth into this concept – you could start by reading the sources that I found directly- then come back and share with us what you learn. So, to my understanding relative risk reduction tells you the difference between the control and the intervention. It does not tell you the risk for the control group and the risk for the intervention group OVERALL. That is the absolute risk. In order to get a good zoomed out picture of the situation, understanding both the relative risk and the absolute risk is important.

Definition of relative risk: “Relative risk is a ratio of the probability of an event occurring in the exposed group versus the probability of the event occurring in the non-exposed group.” (3.)

Example from Peter Attia’s blog (2.)

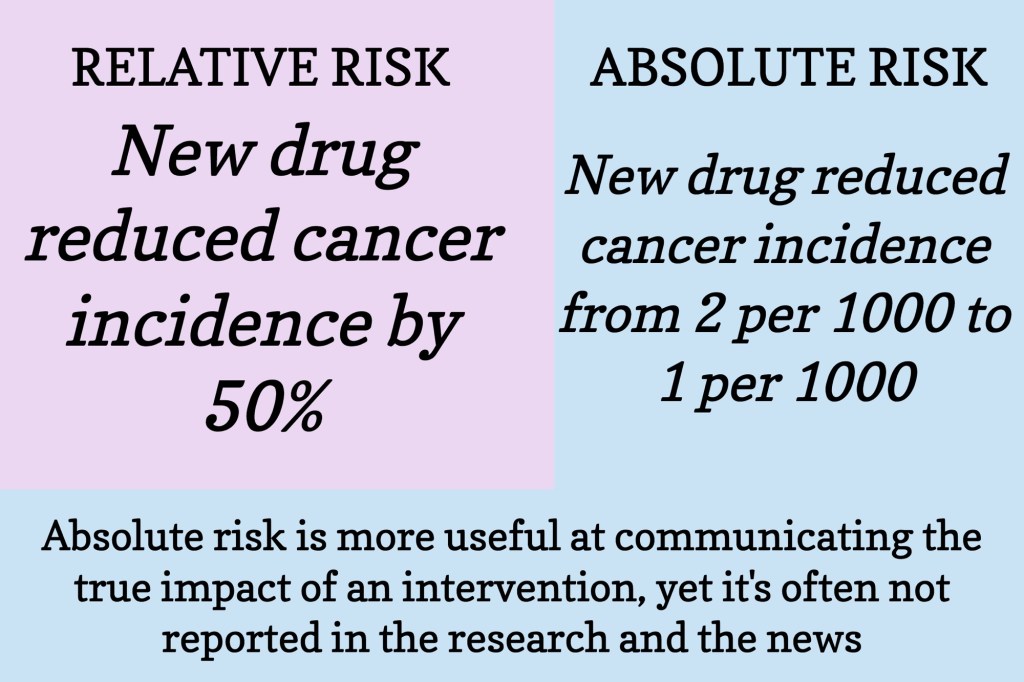
In the example above, the absolute risk gives you the overall risk of cancer incidence. While the relative risk is the difference between those two numbers. So, reducing the cancer incidence from 2/1000 to 1/1000 was a 50% decrease. But when you look at the overall risk of this cancer incidence, one question would be: is the medication worth the change in risk from 2 in 1000 people to 1 in 1000 people?

For our meta analysis we’re working with here, we know the relative risk reduction for diabetes/hypertension of breastfeeding for more than 12 months compared to breastfeeding for less than 12 months.

But, what is the absolute risk? I think the question that needs addressed before we can determine absolute risk is: What percentage of women acquire diabetes/hypertension in the years after they give birth (not during pregnancy or before child birth)?

If we had that knowledge then we could start to determine the overall risk these women have of getting diabetes/hypertension as it relates to breastfeeding.

This was a challenge, grasping relative risk. If you can share some knowledge, please drop a comment below and include your credentials (again, I don’t care if you’ve been in the research field for decades or this is your first time digging into this – giving us your credentials just helps everyone learn through the comments.)

Does ‘compared with breastfeeding for less than 12 months’ include those who did not initiate breastfeeding? I’d like to learn more about the length of time that people breastfed for when it was ‘less than 12 months”. Did the majority of them breastfeed for 3 months or 9 months or 2 weeks?

References:

1. Rameez RM, Sadana D, Kaur S, et al. Association of Maternal Lactation With Diabetes and Hypertension: A Systematic Review and Meta-analysis. JAMA Netw Open. 2019;2(10):e1913401. doi:10.1001/jamanetworkopen.2019.13401

2. Attia, Peter “Studying Studies: Part I – relative risk vs. absolute risk”. Updated 1/8/2018. Accessed 5/8/2025. https://peterattiamd.com/ns001/

3. Tenny S, Hoffman MR. Relative Risk. [Updated 2023 Mar 27]. In: StatPearls [Internet]. Treasure Island (FL): StatPearls Publishing; 2025 Jan-. Available from: https://www.ncbi.nlm.nih.gov/books/NBK430824/

4. Calder, Robert A. “Statistical Thinking Part 2: Relative Risk, Absolute Risk, and Number Needed to Treat”. WMJ. 2024;123(4):324-327. Accessed 5/10/2025. https://wmjonline.org/123no4/calder/

Human Milk Nutrients After the First Year

Does breastmilk still contain quality nutrients after the first year? Yes! Let’s hit the highlights

Suzanne Sanders here, IBCLC for an article review.

This study titled “A longitudinal study of human milk composition in the second year postpartum: implications for human milk banking” was published online in 2016 and in a peer reviewed journal in 2017 [1]. What I found particularly interesting was the change of nutrient levels in mothers own milk when assessed from 11-17 months postpartum. What nutrients did they assess? Good question.

They measured:

Total protein

Total fat

Lactose

Lactoferrin

Lysozyme

Immunoglobulin A (IgA)

Calcium

Iron

Zinc

Potassium

Sodium

Total HMO’s

Once a month, the 19 participants were instructed to completely express the content of one breast during the first or second feed of the morning. One requirement to be in the study was all participants had to have ‘access to a breast pump’.

After assessing 131 samples from the 19 women who were lactating from 11-17 months postpartum. The authors concluded

“Our study found that human milk in the second year postpartum contains stable or increasing concentrations of macronutrients and bioactive factors, and small decreases in concentrations of zinc and calcium in women who continue to breastfeed or express milk at least three to four times per day.”

Figure 1 gives you a simple visual of these results.

Figure 1. Perrin MT, Fogleman AD, Newburg DS, Allen JC. A longitudinal study of human milk composition in the second year postpartum: implications for human milk banking. Matern Child Nutr. 2017 Jan;13(1):e12239. doi: 10.1111/mcn.12239. Epub 2016 Jan 18. PMID: 26776058; PMCID: PMC6866067.

What I found interesting is one factor that predicted a change in nutrient levels was the amount of breastmilk that a mom produced. As the amount of milk that the mother had decreased most of the nutrient concentrations increased.

The authors stated, “this research suggests that volume was a more consistent predictor of milk composition than month of lactation”

The primary purpose of this article was “to describe longitudinal changes in human milk composition in the second year postpartum” to help determine whether expressed breastmilk past 1 year could be eligible for milk bank donation. Here is what this one study concluded:

“Accepting milk bank donations from lactating mothers beyond one year postpartum could increase the supply of PDM (pasteurized donor milk) while also raising the concentration of total protein, lactoferrin, IgA and lysozyme in pooled donor milk; however mineral fortification might be considered.”

Remember, typically research is confirmed in multiple different studies before it has the gumption to impact real world policies. I found this article very interesting, especially in relation to the AAP and WHO recommendations of breastfeeding for at least two years. And, it would be great to see more availablity of pasteurized donor human milk.

If this topic interests you, read the research article and share your thoughts in the comments. I want your input whether you’ve been in the research field for 20 years or whether this is the very first research article you’ve ever read. Just do me one favor, to help me and our other readers further our knowledge, when you comment please include your credentials or experience with reading research.

(You can find my credentials/experience in About the Author)

What I learned while reading this research: The Coefficient of determination helps us “judge how well the line fits the data” [2]. So this study looked at nutrients in mothers own milk in relation to the month postpartum the milk was pumped (time-effect) and also in relation to the individual person (subject-effect). When they ran the coefficient of determination for both the time effect and the subject effect, they found that the subject effect was more accurate than the time effect. The dependent variables were more reliant on the subject than on the month postpartum. So I did a dive into coefficient of determination and learned that basically that is looking to determine if the line on the graph accurately represents the data points. See figure 1 again, below. The coefficient of determination is looking to see how far away the data points are from the bold black line, which gives us an idea of how accurate the line is to the actual data [3].

Figure 1. Perrin MT, Fogleman AD, Newburg DS, Allen JC. A longitudinal study of human milk composition in the second year postpartum: implications for human milk banking. Matern Child Nutr. 2017 Jan;13(1):e12239. doi: 10.1111/mcn.12239. Epub 2016 Jan 18. PMID: 26776058; PMCID: PMC6866067.

1. Perrin MT, Fogleman AD, Newburg DS, Allen JC. A longitudinal study of human milk composition in the second year postpartum: implications for human milk banking. Matern Child Nutr. 2017 Jan;13(1):e12239. doi: 10.1111/mcn.12239. Epub 2016 Jan 18. PMID: 26776058; PMCID: PMC6866067.

2. Hamilton DF, Ghert M, Simpson AH. Interpreting regression models in clinical outcome studies. Bone Joint Res. 2015 Sep;4(9):152-3. doi: 10.1302/2046-3758.49.2000571. PMID: 26392591; PMCID: PMC4678365.

3. Khan, Sal “R-squared or coefficient of determination” (video). Khan Academy Accessed April 21, 2025. https://www.khanacademy.org/math/ap-statistics/bivariate-data-ap/assessing-fit-least-squares-regression/v/r-squared-or-coefficient-of-determination.