
After being a lactation consultant at both a pediatric clinic and a hospital in the United States, I have come to rely heavily on the World Health Organization Growth Chart when assessing adequate growth for littles. A mom comes in worried about her supply or worried about how often (or not so often) baby is nursing, one of the first things I look at is baby’s trajectory on the weight-for-age WHO Growth Chart. As this is such an integral part of my evaluation, I wanted to dig into this tool to learn more about it. I found some fascinating tidbits!
- They used data from both a longitudinal study that was conducted with babies aged 0-24 months, AND from a cross-sectional study with children aged 18 months – 71 months.
- The children in these studies were from 6 different countries all around the world. (1.)
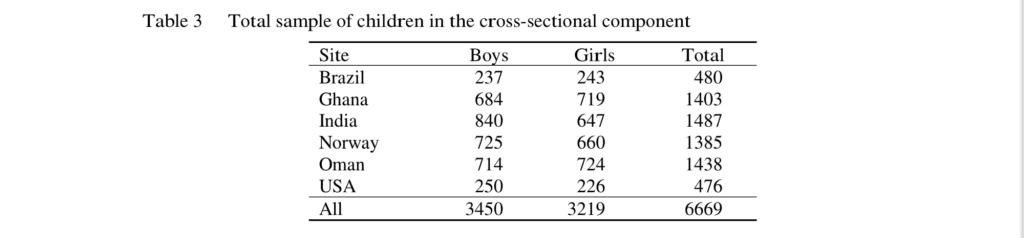
- They had a total of 882 children in the longitudinal study that were followed through 24 months of age. They had a total of 6,669 children in the cross-sectional study. (1.)
- Some of the requirements for the longitudinal study included: no smoking prenatally and postpartum, no known constraints to growth, breastfeeding: exclusively or predominantly for at least 4 months, and continued partial breastfeeding until at least 12 months with complementary foods introduced by 6 months. (1.)
- A minimum of any breastfeeding for at least 3 months was the requirement for the cross-sectional study. (1.)
- This was intentionally created as a ‘standard’, not merely a reference. (1.)
- Standard = “Since a standard defines how children should grow, deviations from the pattern it describes are evidence of abnormal growth.” (1.)
- Reference = While a reference shows how children grow in a particular region and time, it “does not provide as sound a basis for such value judgments” (1.)
First off, look at these two tables. They give a good overview of the sheer number of children that were assessed and the various locations world wide.

What I found so fascinating was the similarity in growth among these healthy children all over the world. No matter what country they were in, their growth was very consistent. Between the consistency of growth in healthy, breastfed babies around the globe and the fact that this was intentionally designed as a standard; this is a really encouraging reminder that the growth charts do give us a strong glimpse into the rate that healthy children grow. After digging into this, I still feel confident in the WHO Weight-for-Age Growth Chart. One interesting comment the authors made at the end of their conclusion is that “…links between physical growth and motor development provide a solid instrument for helping to meet the health and nutritional needs of the world’s children.” Which leads to my question – Should the WHO Growth Chart be used in combination with an a motor development component?
“The MGRS (WHO Multicentre Growth Reference Study) is unique in that it was purposely designed to produce a standard by selecting healthy children living under conditions likely to favour the achievement of their full genetic growth potential.” (1.)

Should I start incorporating the Motor Development Milestones into my assessment?
Let’s dig in. Since they reference motor development in combination with physical growth, I wanted to learn more about the Motor Development aspect. Turns out between the ages of 4 and 24 months during the longitudinal study, they looked at the six gross motor developmental milestones of healthy children from 5 different countries around the world. (2.)
- Sitting without support
- Hands-and-knees crawling
- Standing with assistance
- Walking with assistance
- Standing alone
- Walking alone
They then used this data to create a simple, visual scale that depict the age range that these healthy children achieved the milestones. If the child is older than the ‘window’ and not demonstrating the skill, appropriate screening can be pursued. See the figure below.
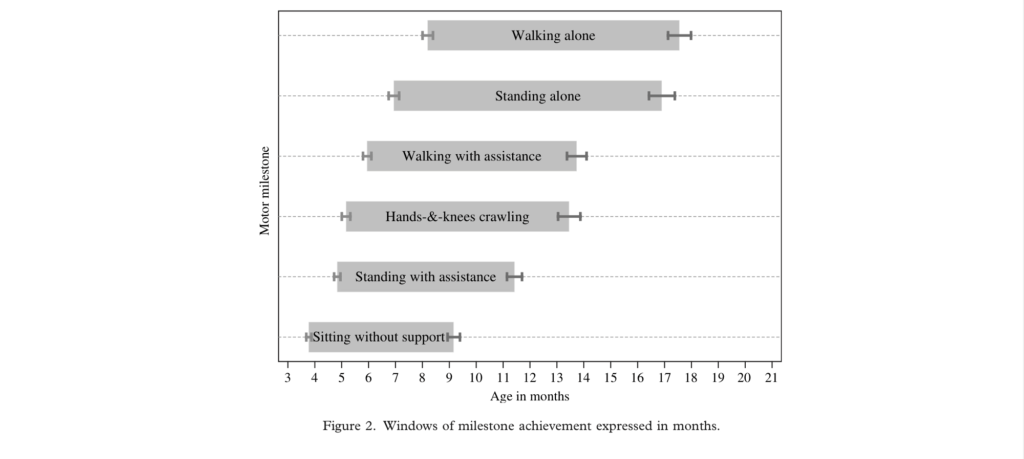
WHO Motor Development Study: Windows of achievement for six
gross motor development milestones (2.)
What intrigued me was that the earliest ‘age window’ does not close until 9.4 months (sitting unsupported). Which sounds to me like if I wanted to tie this into my assessment, it would give me very limited knowledge until the child being assessed reaches 9 months. Do you incorporate motor development when assessing how your patient is growing?

Since using the growth charts so frequently I inherently had a good understanding of what the percentiles mean. But explaining the percentiles in verbiage that brand new, sleep deprived parents can understand was a bit more challenging. So, I learned a few different ways to explain percentiles. What one parents hears tends to be different than what another parent hears, even if the words are in the exact same order.
- Looks like your little one has been staying pretty close to the 20th percentile the last few visits. The 20th percentile means that he weighs more than 20% of other boys his age, and less than 80% of other boys his age. Since he is tracking consistently near the same number, that tells us he is growing normally and gaining weight well. (4.)
- Looks like your little one has been growing consistently near the 80th percentile. Since her growth has been consistently near the same percentile, that tells us she is growing well and gaining an appropriate amount of weight. The 80th percentile means that out of 100 girls her age, she would weigh more than 80 of them. (3.)
This website had some good examples of how to understand and verbalize percentiles:
https://www.pregnancybirthbaby.org.au/amp/article/understanding-baby-growth-charts (4.)
Resources
